Geophysical Engineering graduate with hands-on experience in gravity data processing, 2.5D forward modelling, and subsurface
interpretation. Skilled in Oasis Montaj, ArcGIS, QGIS with proven ability to process 380+ gravity data points and produce models
with <1% error. Experienced in field operations, geospatial data acquisition, and integrating seismic & non-seismic methods
for exploration projects. I also utilized data analysis tools such as Excel and Python, Tableau with complemented by independent
data analyst projects on drilling analysis, Excel for Human Resource (HR) dashboard and pivot table analysis, and sales spike
analysis.
jochielkana (joelka)
Data Entry CorelDRAW Python Microsoft Office Microsoft Excel Data Analysis Canva RAB (Rencana Anggaran Biaya) GIS & Sensing Remote
Hire Me
Make a Private Project
Invite to Bid
Existing Projects
Make a Private Project
Invite to Bid
Existing Projects

| User Name: | joelka |
| Account Type: | Personal Account |
| Date Registered: | 23/10/2024 11:09:38 WIB |
| Last Seen: | 27/09/2025 16:32:04 WIB |
| Provinsi: | DI Yogyakarta |
| Kabupaten: | Kab. Sleman |
| Website: | |
| Online Hours: | 3.52 |
| Projects Won: | 0 |
| Projects Completed: | 0 |
| Completion Rate | - |
| Projects Arbitrated: | 0 |
| Arbitration Rate | - |
| Current Projects: | 0 |
Ratings & Rankings
As Worker

0.00/10.00
0 Point
No Ranking
0 Projects
0.00/10.00
0 Point
No Ranking
0 Projects
As Owner
0.00/10.00
0 Point
No Ranking
0 Projects
0.00/10.00
0 Point
No Ranking
0 Projects
As Seller
0.00/10.00
0 Point
No Ranking
0 Sales
0.00/10.00
0 Point
No Ranking
0 Sales
As Affiliate
0.00/10.00
0 Point
No Ranking
0 Users
0.00/10.00
0 Point
No Ranking
0 Users
Services
No record found.
Products
No record found.
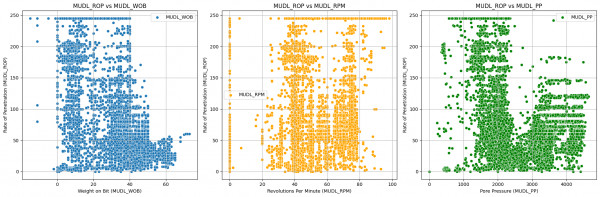
2025: In this project, I analyzed mud log data from well 16A78-32 using Pandas, Seaborn, and scikit-learn to optimize the Rate of Penetration (ROP). The workflow included data cleaning, EDA, predictive modeling, and residual visualization, revealing key parameter impacts and operational sweet spots
to improve drilling efficiency, reduce non-productive time, and lower costs.
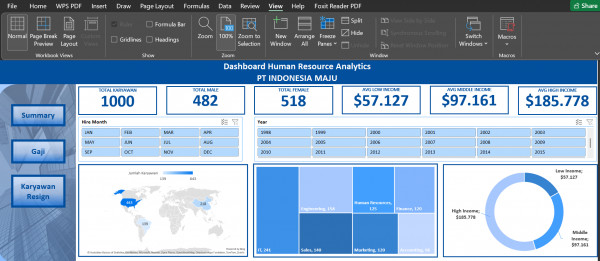
2025: In this project, I processed 1000 data HR records containing employee information such as department, gender, education, job role, and salary. Using Excel functions (SUM, AVERAGE, COUNTIF, IF, VLOOKUP) and Pivot Tables, I performed data cleaning, aggregation, and visualization to uncover insights on workforce distribution, salary patterns, attrition, and gender representation.
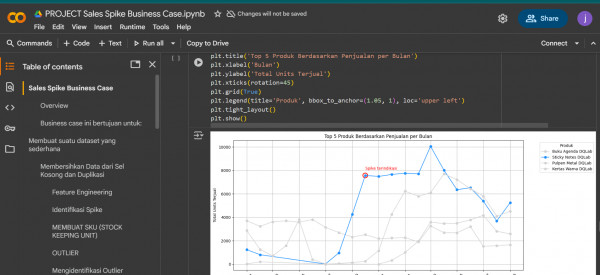
2025: In this project, I conducted Exploratory Data Analysis (EDA) on monthly sales data (2016–2018) by performing data cleaning and aggregation to analyze sales trends. Using Python libraries (Pandas,
Matplotlib, Seaborn) and results revealed irregular sales spikes, with some periods increasing up ton ten times the average, driven by promotions and seasonal events, highlighting opportunities for inventory and campaign optimization.
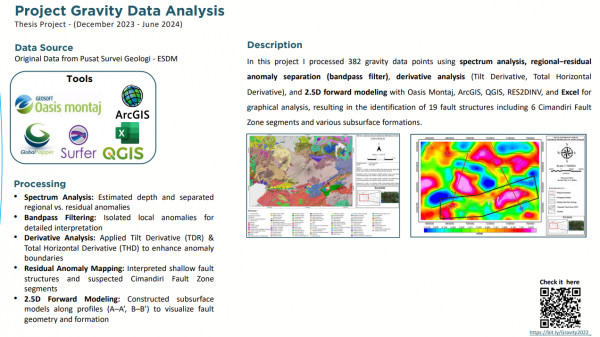
2025: In this project I processed 382 gravity data points using spectrum analysis, regional–residual anomaly separation (bandpass filter), derivative analysis (Tilt Derivative, Total Horizontal Derivative), and 2.5D forward modeling with Oasis Montaj, ArcGIS, QGIS, RES2DINV, and Excel for graphical analysis, resulting in the identification of 19 fault structures including 6 Cimandiri Fault Zone segments and various subsurface formations
No record found.
No record found.
Anda harus login terlebih dahulu untuk melihat data ini.
You must login first to see this data.
 Loading ...