
Hi, I'm Ali Imron, as a passionate data storyteller and business intelligence enthusiast, I am constantly seeking new and innovative ways to turn complex data sets into compelling stories that drive business decisions. In this portfolio, you will find a collection of my projects that showcase my ability to use data visualization, analytics, and storytelling to bring data to life. Each project is built around a unique story, providing insights that help businesses make informed decisions. I have experience working with a variety of data sets and analytical tools, including SQL, Excel, and PowerBI. I am proficient in data analysis, data visualization, and data modeling, and am always exploring new ways to enhance my skills and stay up-to-date with the latest trends and techniques. My goal is to help businesses unlock the full potential of their data by telling stories that are clear, concise, and visually engaging. I invite you to explore my portfolio and see for yourself how I can help you turn your data into actionable insights. Thank you for your interest
Ali_Project (Ali_Project01)
Data Entry Translation MySQL PostgreSQL Microsoft Excel Data Analysis Visual Studio Code Microsoft Power BI
Make a Private Project
Invite to Bid
Existing Projects

| User Name: | Ali_Project01 |
| Account Type: | Personal Account |
| Date Registered: | 13/02/2023 02:57:56 WIB |
| Last Seen: | 14/04/2023 22:52:01 WIB |
| Provinsi: | Kalimantan Timur |
| Kabupaten: | Kota Samarinda |
| Website: | https://aliproject.github.io/ |
| Online Hours: | 3.30 |
| Projects Won: | 0 |
| Projects Completed: | 0 |
| Completion Rate | - |
| Projects Arbitrated: | 0 |
| Arbitration Rate | - |
| Current Projects: | 0 |
Ratings & Rankings

0.00/10.00
0 Point
No Ranking
0 Projects
0.00/10.00
0 Point
No Ranking
0 Projects
0.00/10.00
0 Point
No Ranking
0 Sales
0.00/10.00
0 Point
No Ranking
0 Users
Services
No record found.
Products
No record found.
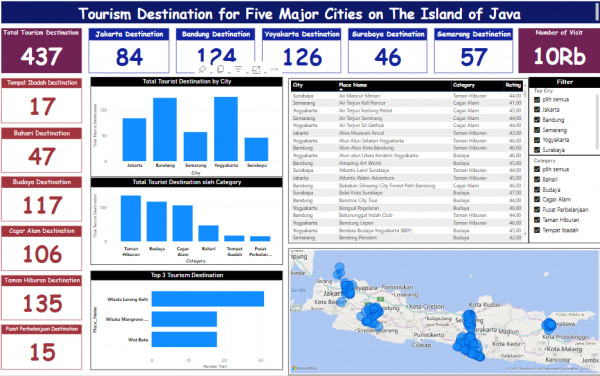
2023: Tourism Destination for Five Major Cities on The Island of Java
Role
Data Analysis and Visualization in Power BI. by Ali Imron
Project goal
CONTENT
This dataset is a dataset that contains several tourist attractions in 5 major cities in Indonesia, namely Jakarta, Yogyakarta, Semarang, Bandung, Surabaya. This dataset is used in the Capstone Project Bangkit Academy 2021 called GetLoc. GetLoc as an application that is able to recommend several tourist destinations according to the user, what the user likes, and several parameters such as city, price, category, and also time. In addition, GetLoc is also able to provide the fastest and cheapest routes in visiting these places, so that your travel experience will be more interesting. You can see the repository here This dataset also consists of 4 files, namely: tourism_ with _id.csv which contains information on tourist attractions in 5 major cities in Indonesia totaling ~400 user.csv which contains dummy user data to make recommendation features based on user tourism_rating.csv contains 3 columns, namely the user, the place, and the rating given, serves to create a recommendation system based on the rating package_tourism.csv contains recommendations for nearby places based on time, cost, and rating
PROCESS
First, import the data to Power BI. Before we load the data, we need to make sure that the data is clean. Click Transform Data.
ANALYZE
First, After getting all the required measures, I added cards in my dashboard to show all the KPIs at the top. Based on the Visualized , there were approximately 10,000 visits to tourism destinations in the locations of Jakarta, Bandung, Yogyakarta, Surabaya, and Semarang. In total, there were 483 tourism destinations across these locations. Out of the five locations, Yogyakarta had the highest number of tourism destinations, with 126 destinations to choose from. Bandung followed closely with 124 destinations, while Jakarta had 84, Semarang had 57, and Surabaya had 46 destinations. and the number of destinations in each category is as follows:
Taman Hiburan (Amusement Parks): 135
Budaya (Cultural Destinations): 117
Cagar Alam (Nature Reserves): 106
Bahari (Marine Destinations): 47
Tempat Ibadah (Religious Sites): 17
Pusat Perbelanjaan (Shopping Centers): 15
there are three tourism destinations in the area that have been identified by name, along with the number of visits they have received:
Wisata Lereng Kelir: This destination has received 31 visits.
Wisata Mangrove Tapakn: This destination has received 18 visits.
Wot Batu: This destination has also received 18 visits.

2023: NHTSA Analyst
Role
THIS IS A GROUP PROJECT ASSIGNMENT AT REFOCUS DIGITAL ACADEMY.
Project goal
Data Analysis Objectives
The main objective of your study is to provide a number of recommendations on how to reduce the number of accidents on highways. To do this, you first need to identify the following data:
Conditions that increase the risk of accidents
Top 10 states where accidents occur the most
Average number of accident occurrences per day based on the time of day the accident occurred
Percentage of accidents caused by drunk drivers
Percentage of accidents in rural and urban areas
Number of accidents by day.
Cleaning Data
The program that we used for data cleaning is pgAdmin 4 using PostgreSQL.
“Elimination & validation of data to other.
Convert the abbreviation “USA” to “Central Standard Time”
ISSUE
There were high numbers of accidents in the United States in 2021, with 35,414 accidents involving 85,311 people. This proves that the regulations or traffic signs that have been established are still inefficient or not adjusted to the factors of accidents that occur. Therefore, an analysis of accident data from the previous year is needed to create more appropriate regulations.
OBJECTIVE
To analyze accident data in 2021, so that from the results of the analysis, new regulations can be created that have the potential to reduce the number of accidents in the future.
FINDING
The analysis conducted is to identify the factors that cause high accident rates. The first variable we analyzed is atmospheric conditions and light conditions. From this, it was found that in atmospheric conditions that are ‘Clear’, the number of accidents is high. The figure is also significantly different from other conditions such as ‘Cloudy’, ‘Rain’, ‘Fog’, ‘Snow’, and others.In terms of light conditions, it was found that ‘Daylight’ actually has a high number of accidents, followed by ‘Dark-lighted’. Contrary to what we assumed, the highest number of accidents from the above data occurred during the day. Next, we analyzed the variables of intersection type or road type and manner of collisions. After data processing, it can be seen that straight roads or ‘Not an intersection’ have higher accident rates compared to other road types with a significant difference.Furthermore, we also looked for states with the highest accident rates. Based on the graph we created, the top three states with the most frequent accidents are Texas, California, and Florida. Each of these states had around 3000 accident cases, while other states only had around 1000 cases.These three states have the highest population in the USA, with California being the most populous, followed by Texas and Florida. However, Texas has the highest accident rate ranking due to a large number of its residents not paying attention to the speed limit set.The next finding is based on the time of the accidents. On average, accidents occur between 10 am to 4 pm. we also analyzed the number of accidents that may have been caused by drunk driving. However, we found that only 25% of all accidents that occurred in 2021 were caused by drunk drivers.We also found that accidents occur more frequently in urban areas, which accounted for 38.8%, compared to rural areas, which accounted for 6.1%. This proves that urban areas have more activities such as schools, work, cafes, malls, and others.Lastly, we also analyzed the occurrence of accidents based on the time of the accidents, including variables such as day, date, and month. For the day variable, we found that accidents occur more frequently on Mondays with 6,111 accidents, followed by Sundays with 5,862 accidents.

2023: Elevating Yellevate
Role
THIS IS A GROUP PROJECT ASSIGNMENT AT REFOCUS DIGITAL ACADEMY.
Project goal
INTRODUCTION
For the past few years, Yellevate has been struggling with client disputes. Yellevate defines disputes as clients expressing dissatisfaction with the company’s services and refusing to pay for them. The team will be following Google’s five phases of data analysis: ask, prepare, process, analyze and share.
Data Analysis Objectives
Statistically, approximately 20% of the Yellevate conflicts resulted in a payment opt-out. This has resulted in a 5% annual revenue loss (in USD). Management has now asked the data analyst team to assist in resolving the problem. The team must identify the reasons for these issues using data gathered by the company and devise practical methods to resolve them.
Executives at the company decided that the following information should be obtained to identify the circumstances around the dispute problem:
The processing time in which invoices are settled (average # of days rounded to a whole number).
The processing time for the company to settle disputes (average # of days rounded to a whole number).
Percentage of disputes received by the company that was lost (within two decimal places).
Percentage of revenue lost from disputes (within two decimal places)
The country where the company reached the highest losses from lost disputes (in USD).
PROCESS
The program that we used for data cleaning is pgAdmin 4 using PostgreSQL. The first thing to do was to create a new database and create a new table. To create a new table, the code is the ff:
Next is to import the dataset in pgAdmin. On the left side panel, right-click on the table that was created earlier, and then select Import/Export Data…
CLEAN DATA
According to the data dictionary, the disputed field has a 0 or 1 value. “1” signifies the customer disputed the invoice; “0” means they did not. When this table is provided to clients, they must understand what the numbers 0 and 1 signify. The team has added a new column that will display Disputed or Not Disputed.
FINDING
Russia has the longest average processing time of 29 days, which is 22.81% longer than China, which has the shortest data of 23 days. Furthermore, the average processing time for the entire dataset is 26 days.
Russia has the highest average processing time of 5 days, which is 2.5 times faster than China, which has an average processing time of 2 days. Furthermore, the average processing time for the five countries is three days.
France has the highest percentage of lost disputes at 34.23% which is 9 times higher than the United States which only has 3.75% lost disputes.
France has the highest percentage of revenue lost from disputes at 13.35% which is 15 times higher than the United States which only has 0.84% lost disputes.
Because France has the highest rate of lost disputes, the country with the biggest losses from lost disputes should be France.
Customers file a dispute with Yellevate because they expected a pandemic exception in their contract but were not given one. As a result, they decided not to pay their invoices or file a dispute. They believe that because of natural disasters, every company should make an exception for their customers.
Consider that the invoice dates occurred during the pandemic, which meant that employees were adjusting to their workforce. Furthermore, the lack of documentation from both parties, and the lack of communication caused the dispute to arise.
Aside from the invoices being settled late, there is no visibility into why they were late and why the invoices were being disputed. It is suggested that we include more information in the dataset, such as the cause for the delay and why it is disputed.
With it, we can get a better understanding of the issue at hand and take the required steps to resolve it. For the time being, since the only ground for a dispute is “Late Settlement,” we can ask the client how the settlement is progressing.
No record found.
No record found.
Anda harus login terlebih dahulu untuk melihat data ini.
You must login first to see this data.
 Loading ...