• (022) 6902 1117

Agus Adiyanto (gusadiyanto)


Data Enthusiast | Data Analytics | Software Engineer

Hi, I am Agus Adiyanto. As a graduate student at Jakarta State University majoring in electrical engineering who has a strong passion for data (data analytics), and coding (software engineering). I am actively involved in this field. I am living in West Jakarta, DKI Jakarta, Indonesia. Currently, I am interested in data and software engineering, especially data analysis.

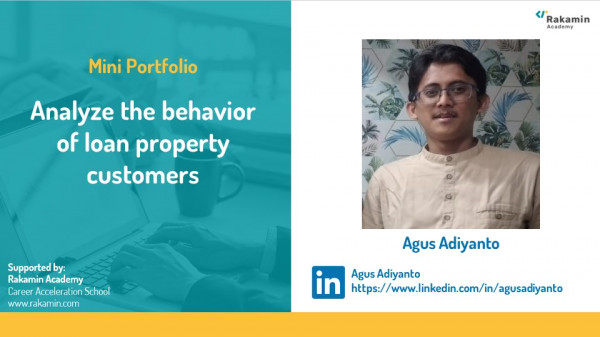
My experience includes taking short courses and creating a mini portfolio on how to analyze data about customer behavior in property loans. Using the Python programming language, I prepared and cleaned the dataset, removed missing values, removed duplicate data, and handled outliers using IQR, seaborn, and boxplot methods. Additionally, I have completed various training and certification programs in the field of data analytics or science.

I work daily in the areas of data analysis (Excel/Spreadsheet, Python, SQL, Google BigQuery, Tableau, Power BI, Looker Studio) and web development (back end using PHP and SQL) and front end (HTML, CSS, and Javascript).

Python MySQL PHP Microsoft Excel Analysis Data Analysis Web Scrapping API Gateway Microsoft Power BI Data Science

  Hire Me
Make a Private Project


  Invite to Bid
Existing Projects


User Name: gusadiyanto
Account Type: Personal Account
Date Registered: 30/10/2023 13:27:53 WIB
Last Seen: 03/11/2024 06:57:14 WIB
Provinsi: DKI Jakarta
Kabupaten: Kota Jakarta Barat
Website: https://agusadiyanto.net
Online Hours: 10.86
Projects Won: 0
Projects Completed: 0
Completion Rate-
Projects Arbitrated: 0
Arbitration Rate-
Current Projects: 0

Ratings & Rankings

As Worker
    
0.00/10.00
0 Point
No Ranking
0 Projects
As Owner
    
0.00/10.00
0 Point
No Ranking
0 Projects
As Seller
    
0.00/10.00
0 Point
No Ranking
0 Sales
As Affiliate
    
8.00/10.00
0 Point
No Ranking
1 Users


Services

Pengolahan dan visualisasi data Anda dari dataset/datasource menjadi data business insight

Rp 350,000     
0.00/10.00 0

Apakah Anda ingin mengolah dan memvisualisasikan data Anda dari dataset/datasource menjadi data business insight atau laporan data analisis? Apakah Anda ingin mendapatkan data business insight atau laporan data analisis dari dataset/datasource? Ini adalah kesempatan Anda :) Saya akan mengolah dan memvisualisasi data Anda dari dataset/datasource menjadi data business insight atau laporan data analisis hanya dengan biaya Rp 350.000,- untuk 10.000 entri/baris per data bulanan. Jika kurang dari 10...


Total Rows: 1 ‐ Showing Page 1 of 1


Products


No record found.


2024: Bootcamp Data Analyst with Excel Batch 12 from DQLab!

Project title: DQFashion Sales 2017 (Analysis of Transactions)

Tools used:
Microsoft Excel (Power Pivot, Power Query, Measure, etc)

Bootcamp Data Analyst with Excel Batch 12 :

- Introduction to Excel, Data Entry, and Formatting
- Basic Formulas and Functions
- Basic Analytic with Charts and Graphs
- Advanced Formula and Functions
- Excel Tables and Named Range
- PivotTables
- Data Cleaning
- Conditional Formatting in Depth
- Import Data External and Power Query
- Power Pivot and DAX
- Advanced Data Visualization (including Sparklines and Map)
- Advanced Data Analysis Techniques
- Data Storytelling (Part 1)
- Data Storytelling (Part 2)
- Data Storytelling and Visualization Project
- Portfolio Session

2024: Analyze The Behavior of Loan Property Customers - Rakamin Academy

Mini Portfolio Data Science Digifest #37 Rakamin Academy

The mini portfolio project analysis of bank customer behavior in making loans aims to find out how customers/customers behave in relation to loans for purchasing/investing in property. Through this analysis, we can analyze the behavior of customers who apply for loans from the bank.

Tools used: Python

Handling missing value, Handling data duplicated, Penyesuaian type data, Handling outlier, Feature encoding

Link portfolio :
https://colab.research.google.com/drive/14RhdpNYcQqvt1TJa-e-Zqgx_Xh-mmO4F?usp=sharing

Link github:
https://github.com/gusadiyanto/rakamin-academy-digifest-37

2024: Diabetes Prediction System with KNN Algorithm

Mini project whose dataset consists of predictive and outcome variables that describe whether a person suffers from diabetes or not. This mini project aims to build a machine learning model using supervised learning methods and the k-Nearest Neighbor (KNN) algorithm in Python.

Tools used: Python

Dataset terdiri dari variabel prediktif dan hasil yang menggambarkan apakah seseorang menderita diabetes atau tidak, Proyek mini ini bertujuan untuk membangun model pembelajaran mesin menggunakan metode pembelajaran terawasi dan algoritma k-Nearest Neighbor (KNN) dengan Python.

DATASET : https://bit.ly/DatasetSCDataMySkillxLionParcel

Link portfolio :
https://colab.research.google.com/drive/1TLXugW8C51Ce9OUILqM2m9R_3qFBixYG?usp=sharing

2024: Sales Store Visualization and Dashboard with Looker Studio

Introduction of Looker Data Studio, accessing Looker Data Studio, connecting and setting up Data Sources, and creating data visualizations. Gain knowledge and insights specifically related to mastering Looker Data Studio and being able to produce good, useful, and innovative output.

Tools used:
Ms. Excel/Google Spreadsheet and Looker Studio

Link portfolio :
https://lookerstudio.google.com/reporting/88ab2e17-45cf-456e-a3e1-702d093bd64f

2024: Sales eCommerce Dashboard with Tableau

Create project mini course RevoU Batch 22 Jul 2024

1. Number of transactions in our e-commerce per month
2. Total income earned per month
3. Total products sold on e-commerce per month
4. Number of transactions & total income based on store type
5. Customer distribution based on city and gender

Tools used:
Ms. Excel/Google Spreadsheet and Tableau

Link portfolio :
https://public.tableau.com/app/profile/agus.adiyanto/viz/SaleseCommerceDashboard/DashboardSaleseCommerce

2024: Dashboard of Health Facilities and Services Profile in West Java with Tableau

Create and contribute a case study (assignment mini course) RevoU Data Analyst Mini Course Batch 22 Jul by theme "Data Analysis & Visualization". Additionally, I learned SQL BigQuery with Google BigGuery. I have learn all about becoming a data analyst.

Tools used:
Ms. Excel/Google Spreadsheet and Tableau

Link portfolio :
https://public.tableau.com/app/profile/agus.adiyanto/viz/DashboardofHealthFacilitiesandGuaranteeinWestJava/DashboardofHealthFacilitiesandServicesProfileinWestJava


No record found.


No record found.


Anda harus login terlebih dahulu untuk melihat data ini.

You must login first to see this data.


Live Chat