
I am a data analyst. I am worked in data center department for 3 year. I am qualifed to handle a dataset and make it ready on visualization.
andraalex1972 (andraalex1972)
Hire Me
Make a Private Project
Invite to Bid
Existing Projects
Make a Private Project
Invite to Bid
Existing Projects
| User Name: | andraalex1972 |
| Account Type: | Personal Account |
| Date Registered: | 03/02/2026 20:42:10 WIB |
| Last Seen: | 07/04/2026 00:10:45 WIB |
| Provinsi: | Kepulauan Riau |
| Kabupaten: | Kota Tanjung Pinang |
| Website: | |
| Online Hours: | 2.16 |
| Projects Won: | 0 |
| Projects Completed: | 0 |
| Completion Rate | - |
| Projects Arbitrated: | 0 |
| Arbitration Rate | - |
| Current Projects: | 0 |
Ratings & Rankings
As Worker

0.00/10.00
0 Point
No Ranking
0 Projects
0.00/10.00
0 Point
No Ranking
0 Projects
As Owner
0.00/10.00
0 Point
No Ranking
0 Projects
0.00/10.00
0 Point
No Ranking
0 Projects
As Seller
0.00/10.00
0 Point
No Ranking
0 Sales
0.00/10.00
0 Point
No Ranking
0 Sales
As Affiliate
0.00/10.00
0 Point
No Ranking
0 Users
0.00/10.00
0 Point
No Ranking
0 Users
Services
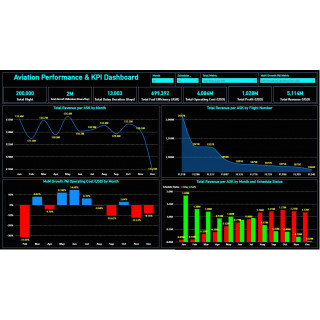
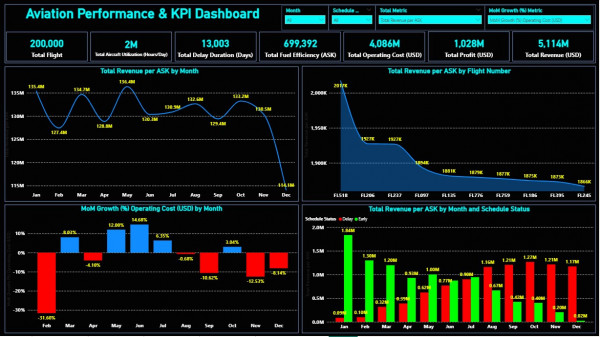
Aviation Performance & KPI's Dashboard
Rp 300,000 0.00/10.00 0
Saya menyediakan jasa pembuatan dashboard Power BI yang interaktif dan mudah dipahami. Layanan saya meliputi: Dashboard KPI (Revenue, Profit, dll) Analisis data (MoM, tren, performa) Visualisasi data yang profesional Custom sesuai kebutuhan bisnis Anda Cocok untuk bisnis, logistik, penjualan, dan lainnya.
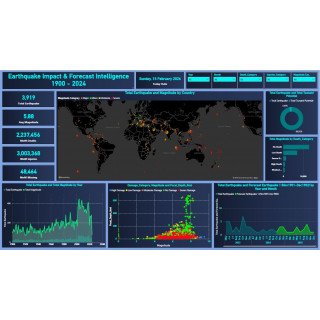
Earthquake Impct & Forecast intelligence Dashboard
Rp 300,000 0.00/10.00 0
Saya mendesain dashboard Power BI interaktif yang menganalisis dan memvisualisasikan data gempa bumi historis dari tahun 1900–2024. Dasbor ini menampilkan magnitudo gempa bumi, lokasi, potensi risiko tsunami, dan mencakup fitur peramalan untuk memprediksi tren. Pengguna dapat menjelajahi data melalui peta, grafik, dan filter untuk dengan cepat memahami pola gempa bumi dan potensi dampaknya.
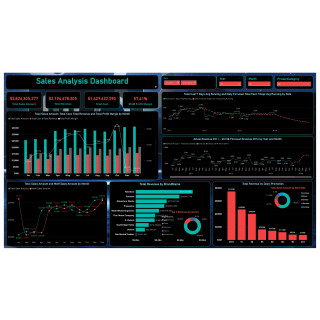
Sales Analisis Dashboard
Rp 150,000 0.00/10.00 0
Saya menyediakan jasa pembuatan dashboard Power BI sederhana untuk membantu Anda menampilkan data menjadi visual yang rapi, informatif, dan mudah dipahami oleh user non-teknis maupun manajemen. Dashboard yang saya buat cocok untuk: Monitoring performa bisnis Laporan penjualan & keuangan Analisis operasional Presentasi dan reporting rutin Paket Standard (Rp150.000) Dengan harga tersebut, Anda akan mendapatkan: ✅ 1 halaman dashboard Power BI ✅ Maksimal 1 file data (Excel / CSV) ✅ Data cleaning ringan (format tanggal, angka, kategori) ✅ 4–6 visual dasar (chart / table / KPI card) ✅ Filter interaktif sederhana (contoh: tanggal / kategori) ✅ Layout rapi & konsisten ✅ File Power BI (...
Total Rows: 3 ‐ Showing Page 1 of 1
Products
No record found.
2026: Saya menyediakan jasa pembuatan dashboard Power BI yang interaktif dan mudah dipahami.
Layanan saya meliputi:
- Dashboard KPI (Revenue, Profit, dll)
- Analisis data (MoM, tren, performa)
- Visualisasi data yang profesional
- Custom sesuai kebutuhan bisnis Anda
Cocok untuk bisnis, logistik, penjualan, dan lainnya.
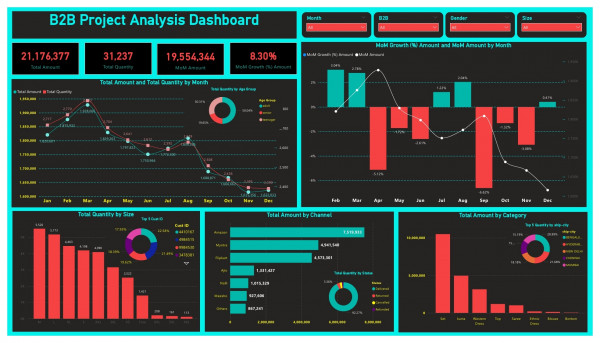
2026: B2B Project Analysis Dashboard
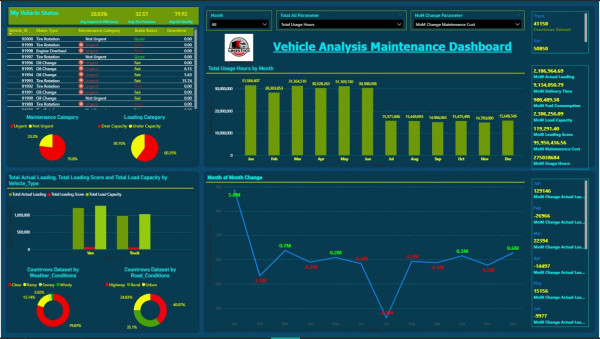
2026: Vehicle Maintenance Analysis Dashboard
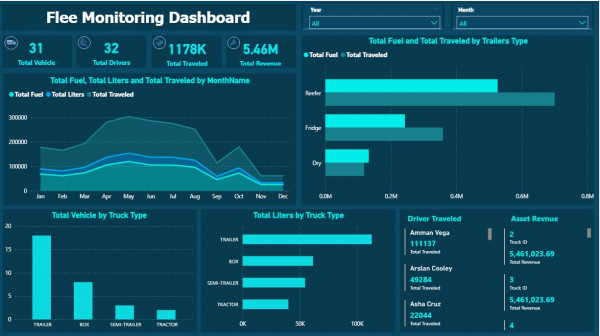
2026: Fleet Montoring Dashboard
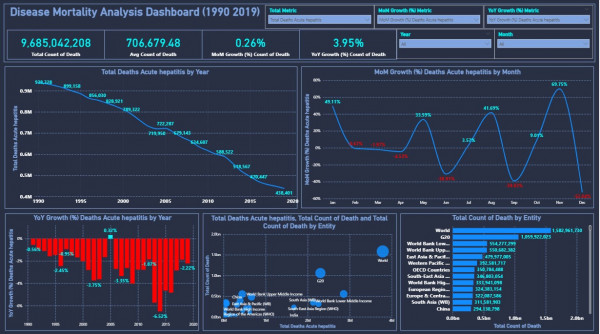
2026: Disease Mortality Analysis Dashboard (1990-2019)
I developed an interactive Power BI dashboard to analyze and visualize disease-related death data from 2020 to 2023. The dashboard provides key insights into total deaths, average monthly deaths, and trends over time using Month-over-Month (MoM) and Year-over-Year (YoY) growth analysis.
The report includes dynamic metric selection, allowing users to switch between different KPIs such as total deaths and average deaths. It also features geographical comparisons across jurisdictions and highlights patterns and anomalies in mortality data.
The goal of this dashboard is to support data-driven decision-making by presenting complex health data in a clear, interactive, and visually engaging format.
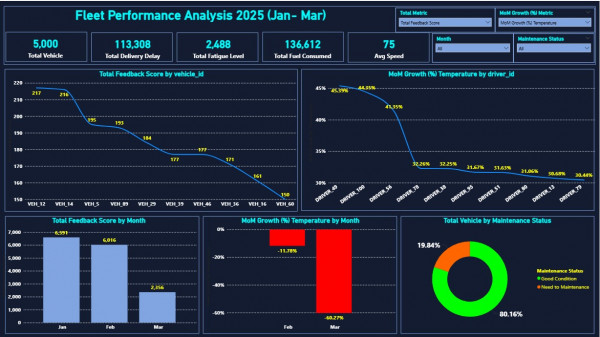
2026: Fleet Performance Analysis Dashboard 2025 (Jan-Mar)
I developed an interactive Power BI dashboard to analyze and visualize disease-related death data from 2020 to 2023. The dashboard provides key insights into total deaths, average monthly deaths, and trends over time using Month-over-Month (MoM) and Year-over-Year (YoY) growth analysis.
The report includes dynamic metric selection, allowing users to switch between different KPIs such as total deaths and average deaths. It also features geographical comparisons across jurisdictions and highlights patterns and anomalies in mortality data.
The goal of this dashboard is to support data-driven decision-making by presenting complex health data in a clear, interactive, and visually engaging format.
No record found.
No record found.
Anda harus login terlebih dahulu untuk melihat data ini.
You must login first to see this data.
 Loading ...