
Saya memiliki keterampilan dalam pemetaan geospasial, analisis data topografi, dan pemetaan menggunakan teknologi canggih seperti LiDAR, GNSS, GIS, dan penginderaan jauh. Saya memiliki kemampuan analitis yang kuat untuk memahami dan menginterpretasikan data geospasial. Saya sangat berorientasi pada detail, memastikan akurasi dan presisi dalam setiap proyek yang saya kerjakan. Saya mahir dalam penggunaan perangkat lunak umum dan teknologi geodetik mutakhir untuk menghasilkan peta dan model yang akurat. Saya telah terlibat dalam berbagai proyek pemetaan dan survei lahan, baik untuk pengembangan infrastruktur, penelitian lingkungan, maupun pemetaan wilayah. Pengalaman saya mencakup bekerja dengan tim multidisiplin dan berkontribusi pada keberhasilan proyek dengan menyediakan data geospasial yang akurat dan andal.
neiradesign01 (neiradesign01)
CorelDRAW Adobe PhotoShop Microsoft PowerPoint Microsoft Word Microsoft Excel Google Maps GIS & Sensing Remote
Make a Private Project
Invite to Bid
Existing Projects

| User Name: | neiradesign01 |
| Account Type: | Personal Account |
| Date Registered: | 20/01/2025 10:08:19 WIB |
| Last Seen: | 01/02/2025 14:49:42 WIB |
| Provinsi: | Jawa Barat |
| Kabupaten: | Kota Depok |
| Website: | |
| Online Hours: | 1.24 |
| Projects Won: | 0 |
| Projects Completed: | 0 |
| Completion Rate | - |
| Projects Arbitrated: | 0 |
| Arbitration Rate | - |
| Current Projects: | 0 |
Ratings & Rankings

0.00/10.00
0 Point
No Ranking
0 Projects
0.00/10.00
0 Point
No Ranking
0 Projects
0.00/10.00
0 Point
No Ranking
0 Sales
0.00/10.00
0 Point
No Ranking
0 Users
Services
No record found.
Products
No record found.
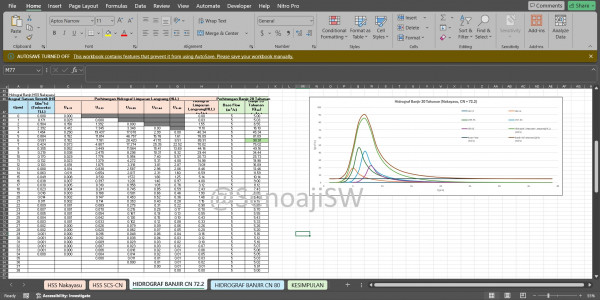
2024: In my role, I was responsible for collecting, processing, and analyzing 10 years' worth of rainfall data to calculate reliable flow rates, flood hydrographs, and peak flood discharges. Here's a detailed breakdown of the work accomplished:
Data Collection: I meticulously gathered rainfall data over a 10-year period, ensuring the dataset was comprehensive and accurate for analysis.
Data Processing: I systematically organized and processed the collected rainfall data, cleaning it to remove any inconsistencies and preparing it for detailed analysis.
Data Analysis: Using advanced statistical and hydrological tools, I analyzed the 10-year rainfall data to calculate key metrics including:
Reliable flow rates: Determining consistent flow rates based on historical rainfall patterns.
Flood hydrographs: Creating graphical representations of flood events over time to understand their characteristics.
Peak flood discharges: Calculating the maximum flood discharge rates to assess potential flood risks.
Overall, my work involved transforming a decade of raw rainfall data into critical hydrological insights, providing valuable information for flood management and planning.
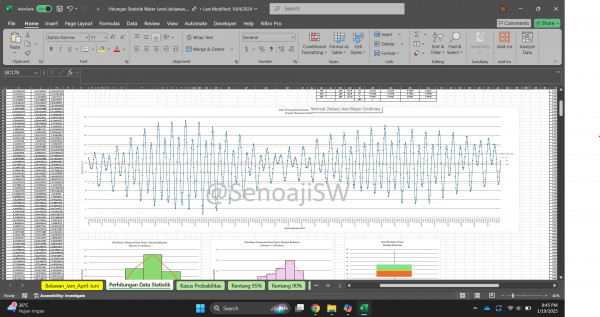
2024: In my role, I processed, analyzed, and presented infographics derived from the statistical analysis of tidal data. Over a 3-day recording period, I handled 744 records of tidal data. Here's a detailed breakdown of the work accomplished:
Data Processing: I systematically collected and organized 744 tidal data records, ensuring their accuracy and completeness. This involved meticulous data cleaning and preparation.
Data Analysis: Using advanced statistical tools and software, I analyzed the tidal data to uncover significant trends, patterns, and anomalies. My analysis provided meaningful insights into tidal behavior over the specified period.
Infographic Presentation: I designed and created visually compelling infographics that effectively communicated the results of the statistical analysis. These infographics highlighted key findings and trends in an engaging and easily understandable format.
Overall, my work involved transforming raw tidal data into valuable insights through rigorous analysis and presenting these insights in a clear and visually appealing manner.
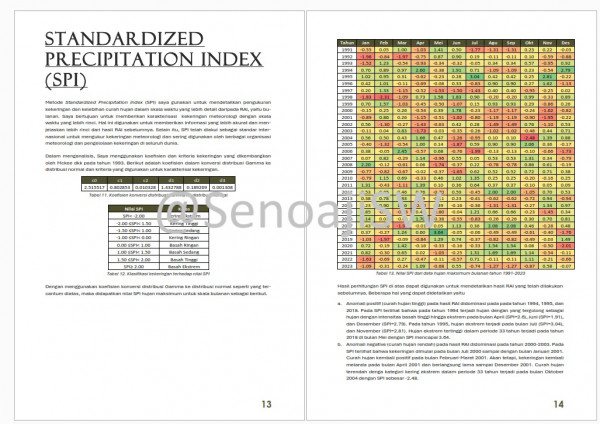
2025: In my role, I was responsible for collecting, processing, and analyzing daily rainfall data over a period of 30 years to calculate the Standard Precipitation Index (SPI). Here's a detailed description of my work accomplishments:
Data Collection: I meticulously gathered daily rainfall data for a continuous 30-year period, ensuring the dataset was comprehensive and accurate for subsequent analysis.
Data Processing: I systematically organized and processed the collected rainfall data, cleaning it to remove any inconsistencies and preparing it for detailed analysis. This step included verifying data integrity and completeness.
Data Analysis: Using advanced statistical tools and techniques, I analyzed the 30-year daily rainfall data to calculate the Standard Precipitation Index (SPI). This index provides a measure of drought severity and is essential for understanding precipitation anomalies over various time scales.
Overall, my work involved transforming extensive raw rainfall data into valuable insights through rigorous analysis, providing critical information for drought assessment and water resource management.
No record found.
No record found.
Anda harus login terlebih dahulu untuk melihat data ini.
You must login first to see this data.
 Loading ...