• (022) 6902 1117

renipuspita (renipuspita)


Hello, my name is Reni Puspita Sari. I hold a degree in Nutrition Science and have approximately 5 years of experience in the field of sales. I spent 4 years as a sales trainer and 1 year as a training advisor.

Currently, I am passionate about data analysis and have successfully completed a full stack data analyst bootcamp with Revou. I am proficient in various analytical tools such as spreadsheets, Microsoft Excel, SQL, Python, Tableau, and Looker Studio.
My analysis capabilities include :
1. Marketing Campaign Analysis
2. Customer Segmentation
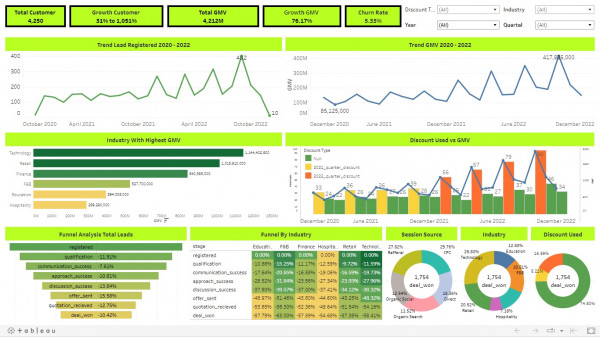
3. Interactive Dashboard Creation
4. Forecasting
5. Funnel Analysis

Thank you

Data Entry Translation Python MySQL Microsoft Excel Data Analysis

  Hire Me
Make a Private Project


  Invite to Bid
Existing Projects


User Name: renipuspita
Account Type: Personal Account
Date Registered: 05/11/2023 14:40:06 WIB
Last Seen: 15/12/2023 14:42:00 WIB
Provinsi: Jawa Barat
Kabupaten: Kota Bekasi
Website:
Online Hours: 26.72
Projects Won: 0
Projects Completed: 0
Completion Rate-
Projects Arbitrated: 0
Arbitration Rate-
Current Projects: 0

Ratings & Rankings

As Worker
    
0.00/10.00
0 Point
No Ranking
0 Projects
As Owner
    
0.00/10.00
0 Point
No Ranking
0 Projects
As Seller
    
0.00/10.00
0 Point
No Ranking
0 Sales
As Affiliate
    
0.00/10.00
0 Point
No Ranking
0 Users


Services


No record found.


Products


No record found.


2023: Customer segmentation is the project of dividing a larger market or customer base into smaller, distinct groups or segments based on specific characteristics, behaviors,
or attributes.

Problem :
Indonesian Investment Startup which makes an application that can buy and sell mutual funds, is planning to create a thematic campaign based on users preference.

Tools & Methodology :
Cleaning and Analyze Data using Python by Google Collab

Analyze & Result :
The majority of users prefer to buy mixed investments, so we
clustered mixed investments and the total buy amount using the KMeans and Elbow Method.
We obtained 4 clusters with distinct characteristics. The highest total investment is found in cluster 1, dominated by Gen X with occupations as homemakers and private sector employees, and their investments primarily consist of
mixed investments.

2023: World Happiness Report Analysis
The analysis provided in the World Happiness Report goes beyond ranking countries based on happiness levels. It serves as a valuable tool for policy decisions, international comparisons, research, public awareness, and initiatives aimed at promoting happiness and well-being on both national and global scales.

Problem :
According to the World Happiness Report from 2015 to 2019, the level of happiness in Indonesia has increased significantly but still below the global average (5,379).

Objective :
To increase Indonesia's Happiness Score by 0.2 points (thus surpassing the global average) within 1 year.

Tools & Methodology :
Cleaning Data : Spreadsheet
Analyze Data : Phyton
Visualization : Tableau

Analyze & Result :
From the correlation results, the variables that have a strong
correlation with the happiness score are economy, health, and family, with respective scores of 0.79, 0.74,
and 0.65. However, upon conducting regression analysis, the
findings reveal that the variables most significantly influencing the prediction of the happiness score are
freedom, economy, and health.
From these results, we can focus on the variables of economy and health to increase the happiness score in
Indonesia

2023: This project is to create interactive dashboard based on company needs

Problem :
PeopleU Company is a B2B Software as a Service (SaaS)
company that offers a human resource management application.
Currently, the focus of PeopleU Company is to increase its
customer . the user�s guide the DA team to provide the proper interactive dashboard, so the user�s can evaluation the marketing process

Tools & Methodology :
Analyze the Data : Google Big Querry
Visualization : Tableau Public

Analyze & Result :
From the visualization,The Total Customer and Revenue have been increasing from 2020 to 2022. That
while there was an increase in customer Churn Rate in 2021, the churn rate decreased in 2022. higher number of customers utilizing discounts in 2022 compared to 2021
with Referral and CPC have a higher percentage in acquiring leads.

Recommendation :
to increase customer by the next year we can continue discount implementation and Focus on Efficient Lead Generation Channels


No record found.


No record found.


Anda harus login terlebih dahulu untuk melihat data ini.

You must login first to see this data.


Live Chat