
Arifah_6 (Arifah_6)
Data Entry Database Programming PHP Administration Microsoft Office Microsoft Excel SQL Server Data Analysis Data Mining Microsoft Power BI
Hire Me
Make a Private Project
Invite to Bid
Existing Projects
Make a Private Project
Invite to Bid
Existing Projects

| User Name: | Arifah_6 |
| Account Type: | Personal Account |
| Date Registered: | 14/01/2026 21:50:45 WIB |
| Last Seen: | 10/07/2026 18:18:14 WIB |
| Provinsi: | Jawa Barat |
| Kabupaten: | Kota Depok |
| Website: | |
| Online Hours: | 16.24 |
| Projects Won: | 0 |
| Projects Completed: | 0 |
| Completion Rate | - |
| Projects Arbitrated: | 0 |
| Arbitration Rate | - |
| Current Projects: | 0 |
Ratings & Rankings
As Worker

0.00/10.00
0 Point
No Ranking
0 Projects
0.00/10.00
0 Point
No Ranking
0 Projects
As Owner
0.00/10.00
0 Point
No Ranking
0 Projects
0.00/10.00
0 Point
No Ranking
0 Projects
As Seller
0.00/10.00
0 Point
No Ranking
0 Sales
0.00/10.00
0 Point
No Ranking
0 Sales
As Affiliate
0.00/10.00
0 Point
No Ranking
0 Users
0.00/10.00
0 Point
No Ranking
0 Users
Services
No record found.
Products
No record found.
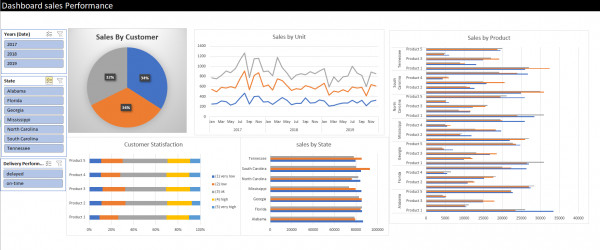
2026: Sales Performance Dashboard
The Sales Performance Dashboard was developed using Microsoft Excel as a data
visualization and analysis tool. This dashboard aims to support management in
monitoring sales performance in a structured, efficient, and data-driven manner.
Key Dashboard Features
1. Interactive Filters
The dashboard provides interactive filters based on year, state, and delivery
performance. These filters allow users to analyze data dynamically according to
specific business needs.
2. Sales by Customer
This visualization illustrates the contribution of each customer to total sales. The
relatively balanced distribution indicates that the business does not rely on a single
major customer.
3. Sales by Unit (Trend Analysis)
The monthly sales trend from 2017 to 2019 helps identify seasonal patterns and sales
fluctuations. This insight can be used for planning and sales forecasting.
4. Sales by Product
This analysis highlights product performance across different regions. It enables
management to identify top-performing products as well as underperforming products
that require improvement.
5. Customer Satisfaction
The customer satisfaction chart shows that most customers fall into the average to high
satisfaction categories. This indicates good product quality and service performance,
while still leaving room for further improvement.
6. Sales by State
Sales performance by state provides a clear overview of regional performance, helping
management prioritize markets and optimize distribution strategies.
Tools & Techniques
� Microsoft Excel
� Pivot Tables & Pivot Charts
� Slicers & Interactive Filtering
� Data Aggregation & Visualization
Conclusion
This dashboard demonstrates that Microsoft Excel can effectively serve as a
foundational Business Intelligence tool for visualizing sales data in a clear and
actionable manner. It provides valuable insights and serves as a solid starting point
before implementing more advanced BI platforms.
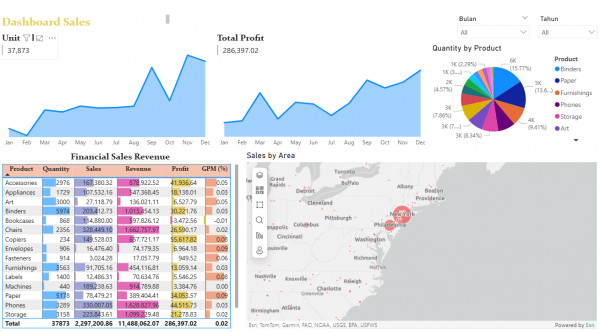
2026: Sales & Profit Performance Dashboard
The Sales & Profit Performance Dashboard was developed using Microsoft Power
BI to visualize sales, profit, and product distribution data in an interactive and
integrated manner. The dashboard supports data-driven managerial decision-making.
Key Dashboard Components
1. Key Performance Indicators (KPIs)
The dashboard highlights core KPIs such as total units sold and total profit, providing a
quick overview of overall business performance.
2. Monthly Sales and Profit Trends
Area charts display monthly sales and profit trends from January to December,
enabling identification of seasonal patterns and peak performance periods.
3. Quantity by Product
The pie chart illustrates sales quantity distribution across product categories, helping
identify products with the highest contribution.
4. Financial Sales Revenue
The financial table presents quantity, sales, revenue, profit, and Gross Profit Margin
(GPM) per product, supported by conditional formatting for faster analysis.
5. Sales by Area
The interactive map visualizes sales distribution by geographic area, supporting market
analysis and regional strategy planning.
6. Interactive Filters
Month and year slicers allow users to perform focused analysis without modifying the
dashboard structure.
Tools & Technologies
� Microsoft Power BI
� Power Query
� DAX (Data Analysis Expressions)
� Interactive Filtering & Drill-down
Conclusion
This dashboard demonstrates how Power BI can be leveraged as a
comprehensive Business Intelligence solution to monitor sales performance,
profitability, and geographic distribution in a single interactive view.
No record found.
No record found.
Anda harus login terlebih dahulu untuk melihat data ini.
You must login first to see this data.
 Loading ...