
Has completed 6 data analytics and data visualization projects in approximately 8 months, with the latest being the creation of a Business Performance Dashboard Report for Foodstory's cloud kitchen (March-April 2023) as part of a Project Assignment with a team of 4 people, achieving a score of 72/76. He has demonstrated his best technical abilities by helping to develop a reservation system as an IT Technician & Support at Hotel Nirmalasari, which successfully increased room reservations by 20%. Supported by his skills in data analytics & data visualization using advanced functions of Microsoft Excel, PostgreSQL, and PowerBI/DAX that he acquired from a Data Analytics bootcamp at Refocus Indonesia, he is currently in the process of learning Python to enhance his knowledge and skills. His primary interest is in a data analysis-related role in the media & technology industry/company.
rionovriandra (rionovriandra)
Adobe PhotoShop Adobe Illustrator Adobe After Effects Adobe Premiere PostgreSQL Microsoft Excel Data Analysis Adobe Indesign Microsoft Power BI
Make a Private Project
Invite to Bid
Existing Projects

| User Name: | rionovriandra |
| Account Type: | Personal Account |
| Date Registered: | 26/05/2023 23:22:54 WIB |
| Last Seen: | 26/05/2023 23:32:56 WIB |
| Provinsi: | Sulawesi Selatan |
| Kabupaten: | Kota Makassar |
| Website: | https://www.novypro.com/profile_projects/rionov |
| Online Hours: | 0.16 |
| Projects Won: | 0 |
| Projects Completed: | 0 |
| Completion Rate | - |
| Projects Arbitrated: | 0 |
| Arbitration Rate | - |
| Current Projects: | 0 |
Ratings & Rankings

0.00/10.00
0 Point
No Ranking
0 Projects
0.00/10.00
0 Point
No Ranking
0 Projects
0.00/10.00
0 Point
No Ranking
0 Sales
0.00/10.00
0 Point
No Ranking
0 Users
Services
No record found.
Products
No record found.
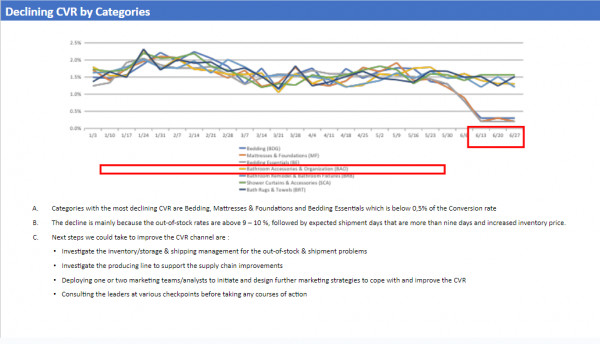
2023: Return on Advertising Spend (ROAS) June 2022 Analysis, Wayfair�s Virtual Program - The Forage
? Creating a hypotheses list for the ROAS decline,
? Performing comprehensive analysis of the data,
? Examining various relevant business metrics,
? Creating charts to summarize ?ndings
? Presenting the root causes and recommendations to improve ROAS effectiveness
? Analytics accuracy 80% / 100%
Tools & Skillset : MS. Excel, MS. PowerPoint
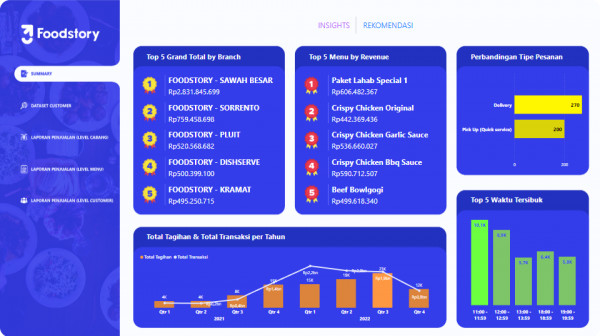
2023: Foodstory Business Performance Dashboard
? Performed collaborative and comprehensive analysis with other team member.
? The objectives of this project are analyzing data from 4 different tables with various metrics for each
report/page,
? Making an interactive dashboard & presenting it to the stakeholders.
? The dashboard itself is equipped with summary page to simplify all the data visualization, ?lters and
pop-up Insight & Recommendation buttons to show insights & recommendation for the stakeholders.
? Team score 72 / 76 - Highest Score
Tools & Skillset : Google Spreadsheets, PowerBI/DAX, Power Query, Adobe Illustrator, Adobe Premiere, Data
Analytics, Data Visualization, Collaboration, Team Management, Presentation

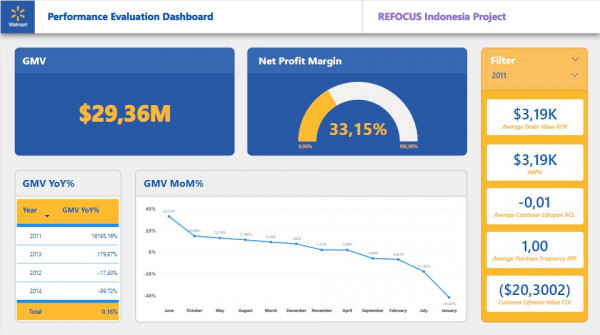
2023: ABC Supermarket Performance Evaluation Dashboard
? Analyze & presented the data based on various metrics into data visualizations
? Designing an interactive dashboards
? Provide written insights for the stakeholders on each page.
Tools & Skillset : PowerBI/DAX, Power Query, Adobe Illustrator, Data Analytics, Data Visualization, Data
Modelling, Presentation
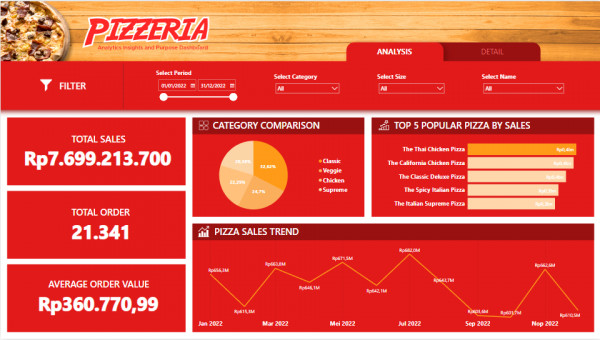
2023: Pizzeria Business Performance Dashboard
? Calculated business metrics and analyzed the performance
? Summarized the data into visualizations
? Making an interactive dashboard for the stakeholders to help them get insights for their next year's plan
Tools & Skillset : PowerBI/DAX, Power Query, Adobe Illustrator, Data Analytics, Data Visualization, Data
Modelling, Presentation
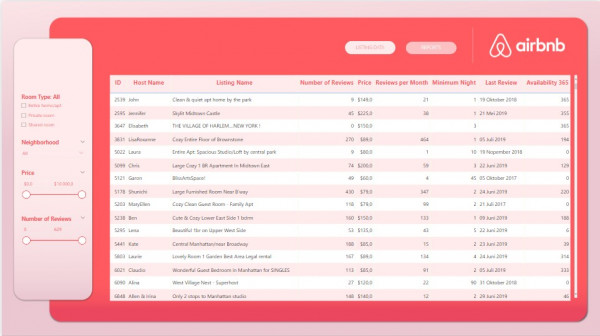
2023: AirBnb Listing Data Report Dashboard
? Created an interactive dashboard that explores AirBnb's listing data in the USA.
? The dashboard was equipped with a ?lter pane and page navigation buttons, it shows various business
metrics such as average price, total listing, number of reviews and so on.
Tools & Skillset : PowerBI/DAX, Power Query, Adobe Illustrator, Data Analytics, Data Visualization, Data
Modelling, Presentation
2023: Walmart Supermarket Data
? Calculated business metrics from the customer & Sales/Marketing side
? Created dashboards using Power BI to present ?ndings and recommendations for the company to
evaluate the performance.
Tools & Skillset : PowerBI/DAX, Power Query, Adobe Illustrator, Data Analytics, Data Visualization, Data
Modelling, Presentation
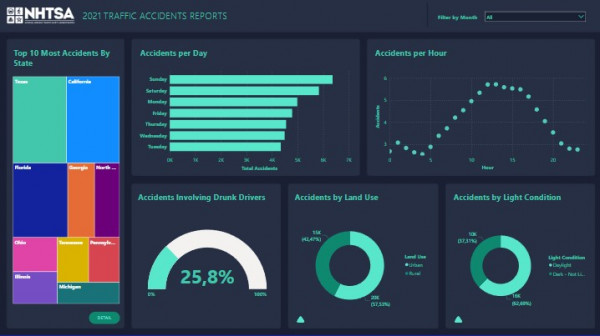
2023: NHTSA Crash Data 2021 Analysis
? Performed collaborative comprehensive analysis with other team member of traf?c accidents in USA to identify root causes
? presented ?ndings and recommendations to decrease traf?c accidents and fatalities in USA.
Tools & Skillset : Google Spreadsheets, MS. Excel, PostgreSQL, MS. PowerPoint, Adobe Illustrator, Adobe
Premiere, Data Analytics, Data Visualization, Collaboration, Team Management, Presentation
No record found.
No record found.
Anda harus login terlebih dahulu untuk melihat data ini.
You must login first to see this data.
 Loading ...